12cR1: optimizer_adaptive_reporting_only issue

A long time ago, when Oracle 12c was widely used and 19c had just been released, I encountered a situation with a client who was experiencing performance issues on an AWS RDS Oracle Database.
I understand that many of you still have clients running older and non-supported versions like 12c, 11g, 10g, 9i, 8i, and so on. Yes, this is the reality we often deal with. I also know you are likely (or should be) recommending upgrades to newer versions like 19c. However, these databases are often tied to legacy applications that will never be certified to run on newer versions.
To make matters worse, many of these databases have never even had a patch applied in their lifetime.
With that in mind, I’d like to share my analysis to provide insights into how a performance analysis report can look and to emphasize the importance of staying informed about the key issues of each Oracle version, patches, etc.
Summary of the Problem
There were three situations in total that we chose to address separately, making it easier to handle and encapsulate each problem as independent:
- AWS resource usage: Is it possible to downsize the current instance?
- Queries performing Full Table Scans (FTS): Two queries were identified as performing FTS, whereas in other environments, they are using indexes and executing with significantly better performance. The table structure and indexes were the same.
- Query from a specific application package: This query performs better when using the hint optimizer_adaptive_reporting_only, but only in this specific database. The others, which are identical, run better without the use of the hint.
Evaluating the First Item
If we reduce the machine's capacity by half:
- The environment would perform up to 30% more physical reads.
- There would be over a 50% increase in SQL code analysis (soft parses). For SQLs that already perform hard parses, performance would degrade even further.
- Current CPU usage fluctuates between 2 and 4 cores processing information simultaneously. At certain times, it reaches 6 cores, even on a regular day (without extreme peaks).
Below is a chart of CPU usage from the past week:
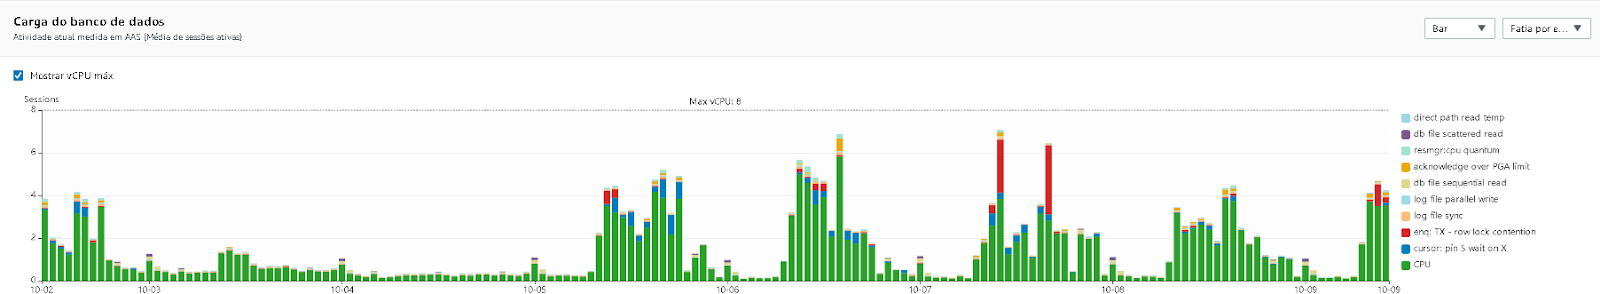
We understand that since the database is hosted in the cloud, the goal is to utilize all machine resources without leaving a large margin of unused capacity. We also understand that high CPU consumption is not necessarily a problem, as it simply indicates that data is being processed. However, when the database reaches a CPU usage peak, other sessions are forced to wait for this resource.
If we reduce the current capacity from 8 CPUs to 4, when all 4 cores are in use, any additional sessions requiring CPU resources will enter a wait state.
Recommendations:
The points below should be reviewed by the development teams to reduce the number of parses, optimize buffer cache usage, and minimize CPU consumption by queries. These optimizations might make it possible to reduce the machine’s capacity without significant side effects.
How to Achieve This:
- Reducing memory usage of the database buffer cache:
- Narrow the query read scope by avoiding Full Table Scans (FTS) in joins, avoiding queries without filters, and ensuring only necessary data is read. This will reduce the number of blocks inserted into memory.
- Use the script below to identify SQLs performing FTS for further optimization:
    SQL> SELECT to_char(sp.timestamp,'DD/MM/RR HH24:MI:SS'),
       sp.sql_id,
       sp.object_name,
       sp.operation,
       sp.options,
       sp.bytes,
       sp.io_cost,
       sq.sql_fulltext
FROM v$sql_plan sp
INNER JOIN v$sql sq ON sq.sql_id = sp.sql_id
WHERE sp.operation = 'TABLE ACCESS'
  AND sp.options = 'FULL'
ORDER BY 1 DESC;
- Reducing parses:
- Use bind variables in repetitive SQLs to eliminate the need for re-parsing during re-execution.
- Use the script below to identify SQLs that are not using bind variables.
- If application changes are not feasible, consider testing the CURSOR_SHARING parameter set to FORCE. This enforces the use of bind variables for literals passed by the application. Testing is crucial, as some systems have exhibited issues with this configuration.
    SQL> WITH lit AS (
    SELECT /*+  MATERIALIZE NO_MERGE  */
        force_matching_signature,
        COUNT(*) cnt,
        MIN(sql_id) min_sql_id,
        MAX(sql_id) max_sql_id
    FROM
        gv$sql
    WHERE
        force_matching_signature > 0
    GROUP BY
        force_matching_signature
    HAVING
        COUNT(*) > 99
)
SELECT /*+  NO_MERGE  */ DISTINCT
    s.parsing_schema_name owner,
    lit.cnt,
    s.force_matching_signature,
    CASE
        WHEN o.object_name IS NOT NULL THEN
            o.object_name
            || '('
            || s.program_line#
            || ')'
    END source,
    lit.min_sql_id,
    lit.max_sql_id,
    s.sql_text
FROM
    lit,
    gv$sql        s,
    dba_objects   o
WHERE
    s.force_matching_signature = lit.force_matching_signature
    AND s.sql_id = lit.min_sql_id
    AND o.object_id (+) = s.program_id
ORDER BY
    1,
    2 DESC,
    3;
- Reducing CPU usage:
- Analyze queries consuming the most CPU resources and assess whether they can avoid execution during peak system usage (e.g., job scheduling).
- If certain queries are fundamental or part of the system workload, consider rewriting them to process only the necessary data and optimize resource usage.
- Use the script below to list SQLs with high CPU consumption for evaluation:
    SQL> SELECT
    *
FROM
    (
        SELECT
            last_load_time,
            cpu_time / 1000000 cpu_time,
            elapsed_time / executions / 1000000 avg_elapsed_time,
            executions,
            disk_reads,
            buffer_gets,
            rows_processed,
            sql_fulltext
        FROM
            v$sqlarea
        WHERE
            last_load_time > SYSDATE - 10
            AND executions > 0
            AND executions < disk_reads
        ORDER BY
            cpu_time DESC
    )
WHERE
    ROWNUM < 21;
On the Second Item:
Several factors could be influencing the CBO (Cost-Based Optimizer) to prefer a Full Table Scan instead of an index access method for the GTT_SELECTION (query below) table records.
We can only perform a realistic test with the table populated, and its routine handles the insertion/deletion of data. However, we can guide the CBO toward better execution plans with some parameter adjustments.
Since the environment is OLTP, I have recommended modifying the following parameters, which are currently set to their default values:
- Change optimizer_index_caching to 80 (currently set to the default of 0): This parameter controls the percentage of index blocks Oracle assumes are cached in the buffer cache. It influences the cost-based optimizer (CBO) when determining the cost of index scans, simulating the effect of caching to favor or disfavor index access paths.
- Change optimizer_index_cost_adj to 20 (currently set to the default of 100): This parameter adjusts the relative cost of index access paths compared to full table scans. Lower values make index accesses more favorable, while higher values make full table scans more attractive to the optimizer.
- Change optimizer_dynamic_sampling to 2 (currently set to 0, meaning no sampling is performed): This enables dynamic sampling of statistics for tables without existing statistics (e.g., GTT tables).
We conducted a verification in other environments of this customer using the same application, and in those environments, these parameters are already configured correctly. It seems that the one we have a problem with is an exception compared to the others.
With these changes, a different query behavior is expected. If the behavior remains unchanged, we recommend removing the query from the library cache to force a new parse and the calculation of a potentially updated execution plan.
Below are the queries, for reference:
Query Examples:
3hxtsdamj9syf
SELECT ND.PRODUCT_ID,
       SUM(ND.QUANTITY_FULFILLED * E.CONVERSION_FACTOR) TOTAL_QUANTITY
  FROM TEMP_SELECTION G, INVOICE_DETAIL ND, PACKAGING E
 WHERE ND.INVOICE_ID = G.SELECTED_ID
   AND E.PRODUCT_ID = ND.PRODUCT_ID
   AND E.BARCODE = ND.BARCODE
 GROUP BY ND.PRODUCT_ID;
ccvr02gjnmk4f
SELECT M.BATCH_ID,
       M.INVOICE_ID,
       SUM(G.QUANTITY_PICKED) TOTAL_QUANTITY_PICKED
  FROM TEMP_PICK_STARTED G, MOVEMENT M
 WHERE M.MOVEMENT_ID = G.MOVEMENT_ID
 GROUP BY M.BATCH_ID, M.INVOICE_ID;
Regarding the Third Item:
For the third item, where using the optimizer_adaptive_reporting_only hint improved query performance, this behavior is expected in Oracle version 12.1.
There were several issues with the optimizer_adaptive_features functionality in version 12.1. It was deprecated in a bundle patch (October 2017, Doc ID 2312911.1) and replaced by two new parameters, which remain in place in version 19c.
For the customer in question, I recommend disabling this feature (setting it to FALSE). After this change, new tests can be performed with the package without using the hint.
Additionally, it is important to note that the optimizer_adaptive_features feature requires the Enterprise Edition license, and I recommend you check yours if you have the same problem. Since the RDS from my client was running as Standard Edition, I recommend evaluating the licensing status if they do not have Enterprise Edition under BYOL.
For evidence, I have included proof of the feature's usage and Oracle documentation confirming that it is an Enterprise Edition feature:
Source: Search for "Adaptive Execution Plans" Oracle Documentation
OPTIMIZER_ADAPTIVE_FEATURES enables or disables all adaptive optimizer features, including adaptive plans (adaptive join methods and bitmap pruning), automatic re-optimization, SQL plan directives, and adaptive distribution methods.
Source: Oracle Documentation
Additional Observations:
In addition to the three items mentioned above, I would also like to point out that the current value of the pga_aggregate_limit parameter is lower than the pga_aggregate_target, causing multiple sessions to enter a wait state for this reason (Acknowledge Over PGA Limit). This triggers Oracle bug 24416451, described in note Doc ID 2437003.1.
To resolve this issue, simply set the pga_aggregate_limit parameter to 0.
Here is Amazon's documentation regarding the possibility of changing this parameter:
Amazon RDS Oracle Documentation

Comments
Post a Comment